

Date: Tue Aug 2, 2016
Time: 1:00 PM - 3:00 PM
Moderator: N/A
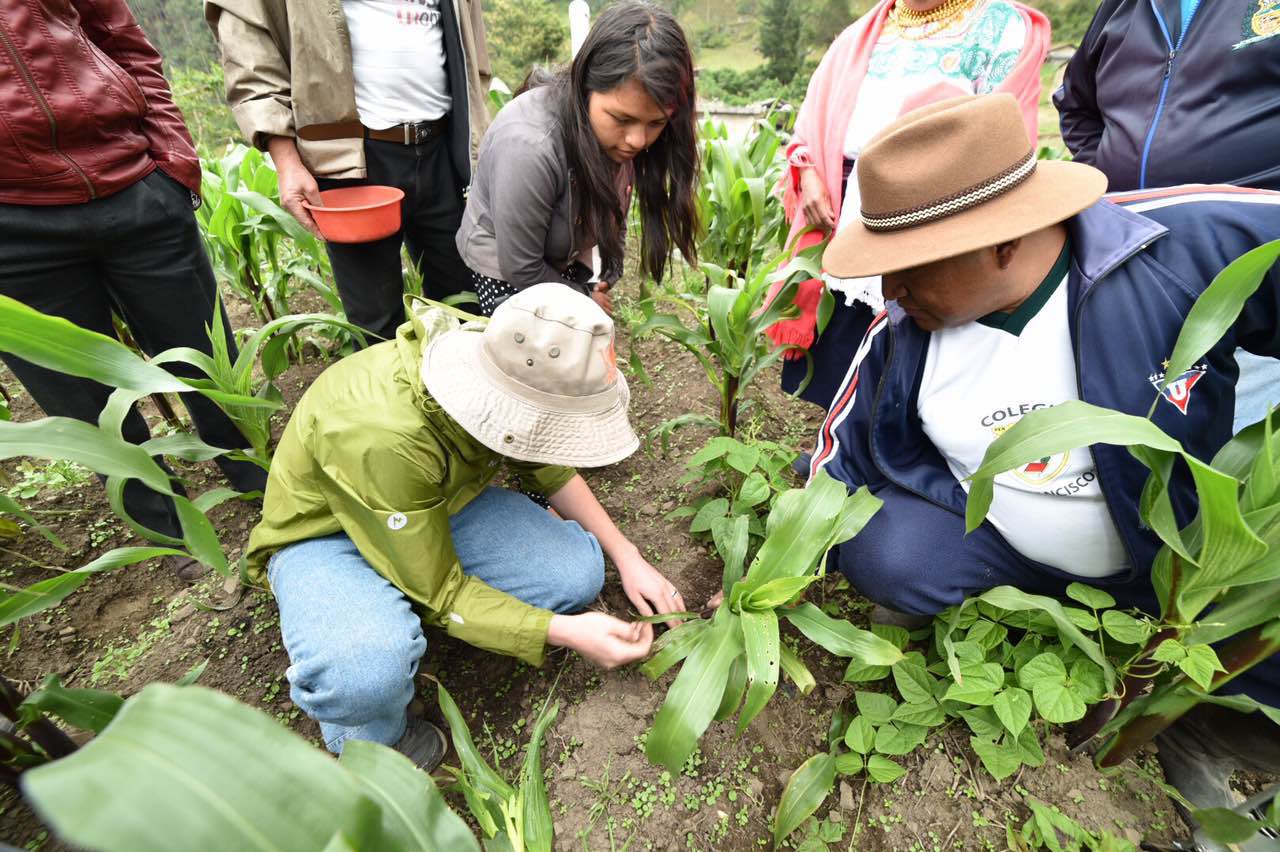
Large temporal and spatial variability in soil N availability leads many farmers across the US to over apply N fertilizers in maize (Zea Mays L.) production environments, often resulting in large environmental N losses. Static N recommendation tools are typically promoted in the US, but new dynamic model-based tools allow for more precise and adaptive N recommendations that account for specific production environments and conditions. This study compares two static N recommendation tools, one based on the Stanford equation (Cornell University Corn N Calculator) and another based empirical response curves (MRTN), to a dynamic simulation tool that combines weather, soil, crop and management information to estimate optimum N application rates for maize, Adapt-N. The efficiency of the tools in predicting the economically optimum N rate (EONR) is compared using field data from multiple N rate strip trials conducted in New York, Indiana, and Ohio. By accounting for weather and site-specific conditions the precision Adapt-N tool was found to improve the prediction of the EONR. Furthermore, using a dynamic instead of a static approach leads to reduced N application rates, increased profits and resulted in reduced simulated environmental N losses. This study shows that application of precision N management through a dynamic tool such as Adapt-N can help reduce environmental impacts while sustaining farm economic viability.

Nitrogen (N) rate recommendation tools are utilized to help producers maximize grain yield production. Many of these tools provide recommendations at field scales but often fail when corn N requirements are variable across the field. This may result in excess N being lost to the environment or producers receiving decreased economic returns on yield. Canopy reflectance sensors are capable of capturing within-field variability, although the sensor algorithm recommendations may not always be as accurate at predicting corn N needs compared to other tools. Therefore, the integration of within-field canopy reflectance sensor tools with field-scale N recommendation tools may help account for yield variability from N applications, and improve N rate recommendations by utilizing the strengths of multiple tools. Research was conducted to determine which N rate recommendation tool was most effective at recommending economical optimal N rates (EONR) under varying soil and weather conditions across the Corn Belt. A second objective using a canopy reflectance algorithm was evaluated to by changing the base N rate of the algorithm which was determined by these tools. Research was conducted on N response plots across eight U.S. Midwest states in 2014 and 2015. Two sites from each state totaling 32 site years, resulting in a range of historically productive areas, were used to evaluate differences in soil and weather environments. Field-scale tools that were compared included pre-plant soil nitrate test, pre-sidedress soil nitrate test, maximum return to N (MRTN), yield goal based calculations, and the Maize-N crop growth model. These tools were also compared to N recommendations form a canopy reflectance sensor using the Holland and Schepers algorithm. Tools were evaluated for an at-planting and/or sidedress N application. Each tool’s performance was evaluated using the root mean square errors (RMSE) and the average difference of the tool’s N recommendation to the measured site’s EONR, and the percentage of sites where the N recommendations were within 30 kg N ha-1 of EONR. A second objective was to determine if the Holland and Schepers algorithm could be improved by integrating the best performing N recommendation tools that were previously evaluated. Tools were integrated by replacing the base N rate, or the farmer’s historical N rate, with the N recommended from the best performing tools. Results of comparing the performance of all tools showed that for recommendations made at-planting the Wisconsin PPNT, MRTN and state-specific yield goals performed the best. For sidedress recommendations MRTN and state-specific yield goal recommendations were the best performing tools. The canopy reflectance sensor using the farmer’s N rate as the base N rate for the algorithm recommendation did not perform as well as the farmer’s N rate as a standalone recommendation. For the second objective of replacing the farmer’s N rate as the base N rate in the algorithm with MRTN or the state-specific yield goal showed minimal improvement. The canopy reflectance sensor performed better when using the scaling factor to increase the MRTN and state-specific yield goal calculations by a factor of 1.75 and 1.65, respectively. The canopy reflectance sensor was best improved by adding 56 and 70 kg N ha-1 to the overall Holland and Schepers algorithm when using MRTN and the state-specific yield goal as the base N rate, respectively. Overall, using these tools as the base N rate for this algorithm is not appropriate as it caused under-recommendations of EONR and growers would be required to speculate on the scaling factor or how much extra N to apply to the recommendation in order to maximize the performance.

Corn production across the U.S. Corn belt can be often limited by the loss of nitrogen (N) due to leaching, volatilization and denitrification. The use of canopy sensors for making in-season N fertilizer applications has been proven effective in matching plant N requirements with periods of rapid N uptake (V7-V11), reducing the amount of N lost to these processes. However, N recommendation algorithms used in conjunction with canopy sensor measurements have not proven accurate in making N recommendations for many fields of the U.S. Corn Belt. The objective of this research was to determine if soil and weather information could be used to make the University of Missouri canopy reflectance sensing algorithm more accurate. Nitrogen response trials were conducted across eight states over two growing seasons, totaling 32 sites (four per state) with soils ranging in productivity. Reflectance measurements at ±V9 were used with the University of Missouri canopy sensor algorithm to calculate an in-season N fertilizer recommendation. This recommendation was related to the economic optimal N rate (EONR). The University of Missouri algorithm was only mediocre in predicting EONR, averaging within 74 kg N ha-1 of EONR when target corn received 45 kg N ha-1 at-planting. However, when this algorithm was adjusted using weather and either measured or USDA SSURGO soil properties the suggested N fertilizer recommendation improved. The error as determined by the root mean square error (RMSE), for corn receiving 45 kg N ha-1 at-planting the RMSE was 74 kg N ha-1 without soil and weather and 52 kg N ha-1 with the soil and weather adjustment. This suggests the incorporation of soil and weather information into other canopy sensor algorithms may enhance their accuracy at predicting site-specific EONR.

Nitrogen (N) needs to support corn (Zea mays L.) production can be highly variable within fields. Canopy reflectance sensing for assessing crop N health has been implemented on many farmers’ fields to side-dress or top-dress variable-rate N application, but at times farmers report the performance of this approach unsatisfying. Another study has shown promise that the performance of canopy sensing algorithms for rate N fertilization can be improved by including soil and weather factors. The objective of this investigation was to validate the performance of weather and soil modified corn algorithms using an independent dataset. The validation dataset was a 16-field investigation conducted over four growing seasons (2004-2007) on three major soil areas of Missouri: alluvium, deep loess, and claypan. Multiple blocks of randomized N rate response plots were arranged end-to-end so that blocks traversed the length of each field (400 to 800 m in length). Each block consisted of eight N treatments from 0 to 235 kg N ha-1 on 34 kg N ha-1 increments, side-dressed sometime between vegetative growth stages V7 and V11. Canopy sensing was done at the time of side-dress application. From these, the economic optimal N rate (EONR) was calculated and compared to the un-adjusted, weather-adjusted, and weather+soil-adjusted algorithm N recommendation rates. Generally, N rate recommendations were not improved by the adjusted algorithms. This was true when examined by individual blocks or when EONR was calculated at the field-level (average over all blocks). While on average recommendations did not improve with the adjusted algorithms, the relationship between EONR and algorithm N recommendation did improve on claypan soils (r2 values of 0.40, 0.82, and 0.89 for unadjusted, weather, and weather+soil algorithms, respectively). These results hint that soil and weather information may help improve canopy sensing N applications in some cases, but additional algorithm development and validation is still needed.


The continuously growing need for increasing the production of food and reducing the degradation of water supplies, has led to the development of several precision agriculture systems over the past decade so as to meet the needs of modern societies. The present study describes a methodology for the detection and characterization of Nitrogen (N) deficiencies in corn fields. Current methods of field surveillance are either completed manually or with the assistance of satellite imaging, which offer infrequent and costly information to the farmers about the state of their fields. The proposed methodology promotes the use of small-scale Unmanned Aerial Vehicles (UAVs) and Computer Vision algorithms that operate with information in the visual (RGB) spectrum. Through this implementation, a lower cost solution for identifying N deficiencies is promoted. We provide extensive results on the use of commercial RGB sensors for delivering the essential information to farmers regarding the condition of their field, targeting the reduction of N fertilizers and the increase of the crop performance. Data is first collected by a UAV that hovers over a stressed area and collects high resolution RGB images at a low altitude. A recommendation algorithm identifies potential segments of the images that are candidates exhibiting N deficiency. Based on the feedback from experts in the area a training set is constructed utilizing the initial suggestions of the recommendation algorithm. Supervised learning methods are then used to characterize crop leaves that exhibit signs of N deficiency. The performance of 84.2% strongly supports the potential of this scheme to identify N-deficient leaves even in the case of images where the unhealthy leaves are heavily occluded by other healthy or stressed leaves.

Remotely sensed vegetation data provide an effective means of measuring the spatial variability of nitrogen and therefore of managing applications by taking intrafield variations into account. Satellites, drones and sensors mounted on agricultural machinery are all technologies that can be used for this purpose. Although a drone (or unmanned aerial vehicle [UAV]) can produce very high-resolution images, the comparative advantages of this type of imagery have not been demonstrated. The goal of this study was to assess the potential benefits associated with the high spatial resolution (5 cm per pixel) of drone-acquired images in comparison to a proximal sensor used for nitrogen status determination in corn. A series of images were acquired over two commercial fields in June 2015. The corn phenological stages at the time of data acquisition ranged from V4 to V6. Images were acquired from a UAV (eBee fixed-wing drone) and from GreenSeeker onboard sensors. The UAV was operated with a modified commercial camera: the Canon S110 NIR (550 nm, 625 nm and 850 nm). Field measurement campaigns were carried out and coordinated with image acquisition in order to obtain quantitative measurements of the biophysical parameters governing vegetation conditions (biomass and leaf area index [LAI]). To assess the potential benefits of image segmentation, a comparative analysis of normalized difference vegetation index (NDVI) maps produced from the GreenSeeker and UAV data was carried out. NDVI maps generated from UAV imagery contained higher spatial detail than those produced by GreenSeeker, but both technologies had good relationships with biomass and LAI. The GreenSeeker R2 relationships with biophysical parameters outperformed those of the UAV.
.JPG)